> ## Documentation Index
> Fetch the complete documentation index at: https://docs.mindosoftware.com/llms.txt
> Use this file to discover all available pages before exploring further.

# Reports dashboard — Build your own board

> How to add widgets, reorder them with drag and drop, resize them and create new boards in the Reports section.

The **Reports** section is your metrics board: at a glance you can see how many messages you received, how many conversations you had, which days and times are busiest, and anything else you need to track. Best of all, the board is yours: you choose which metrics to show, arrange them however works best for you, and create as many boards as you like.

## Video walkthrough

<iframe width="100%" height="400" src="https://www.youtube.com/embed/_jh6r1HqfrU" frameBorder="0" allow="accelerometer; autoplay; clipboard-write; encrypted-media; gyroscope; picture-in-picture" allowFullScreen />

## Before you start

* All you need is access to the **Reports** section. There's nothing to set up beforehand.
* Changes are saved **automatically**: there's no save button.

## Steps

<Steps>
  <Step title="Go to Reports">
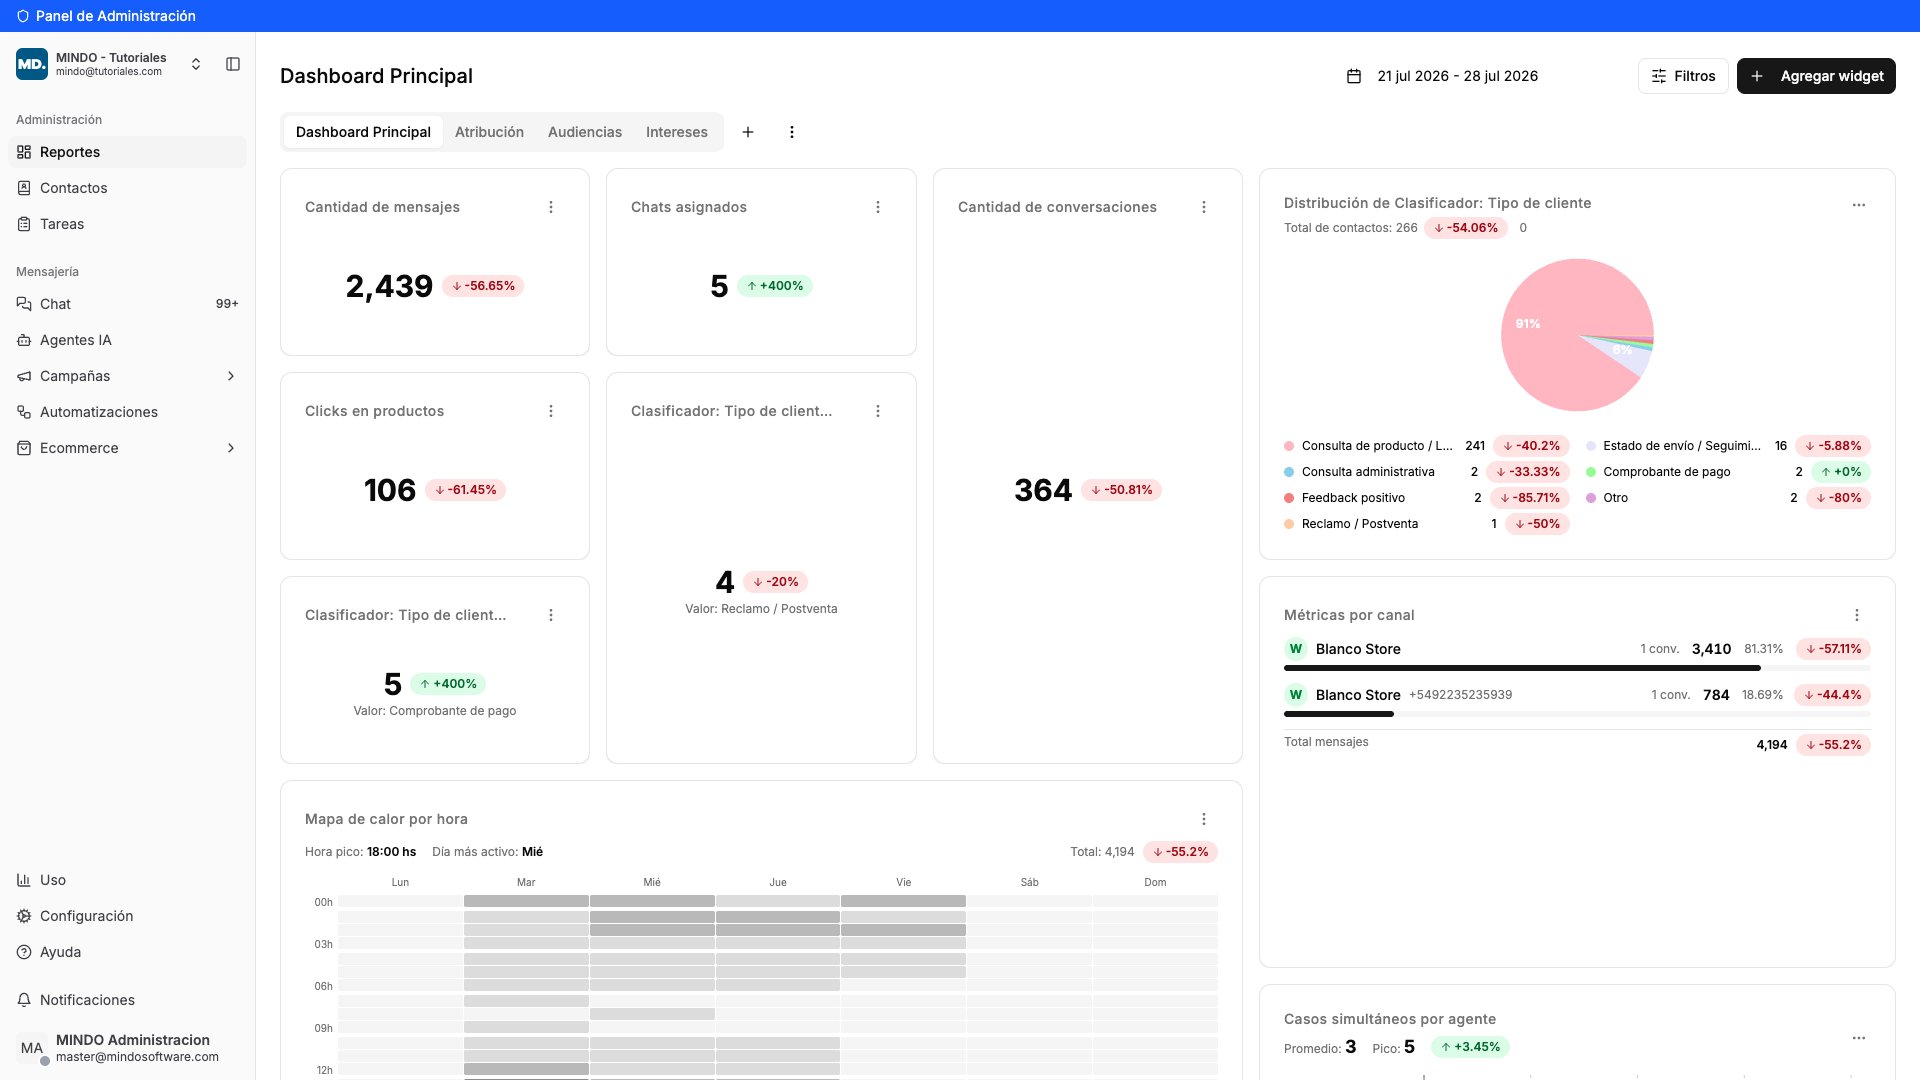
    In the left-hand menu, click **Reports**. You'll see your board with your business metrics. At the top, each tab (*Main Dashboard*, *Attribution*, *Audiences*…) is a separate board.

    <Frame caption="Reports section with boards shown as tabs">
      <img src="https://mintcdn.com/mindo/W8xWRflm-dE_uZ_a/images/tablero-dashboard-01-reportes.png?fit=max&auto=format&n=W8xWRflm-dE_uZ_a&q=85&s=48cad4add05a6504ac1799107babf9a7" alt="Reports section showing the Main Dashboard with widgets and the board tabs at the top" width="1920" height="1080" data-path="images/tablero-dashboard-01-reportes.png" />
    </Frame>
  </Step>

  <Step title="Open the widget picker">
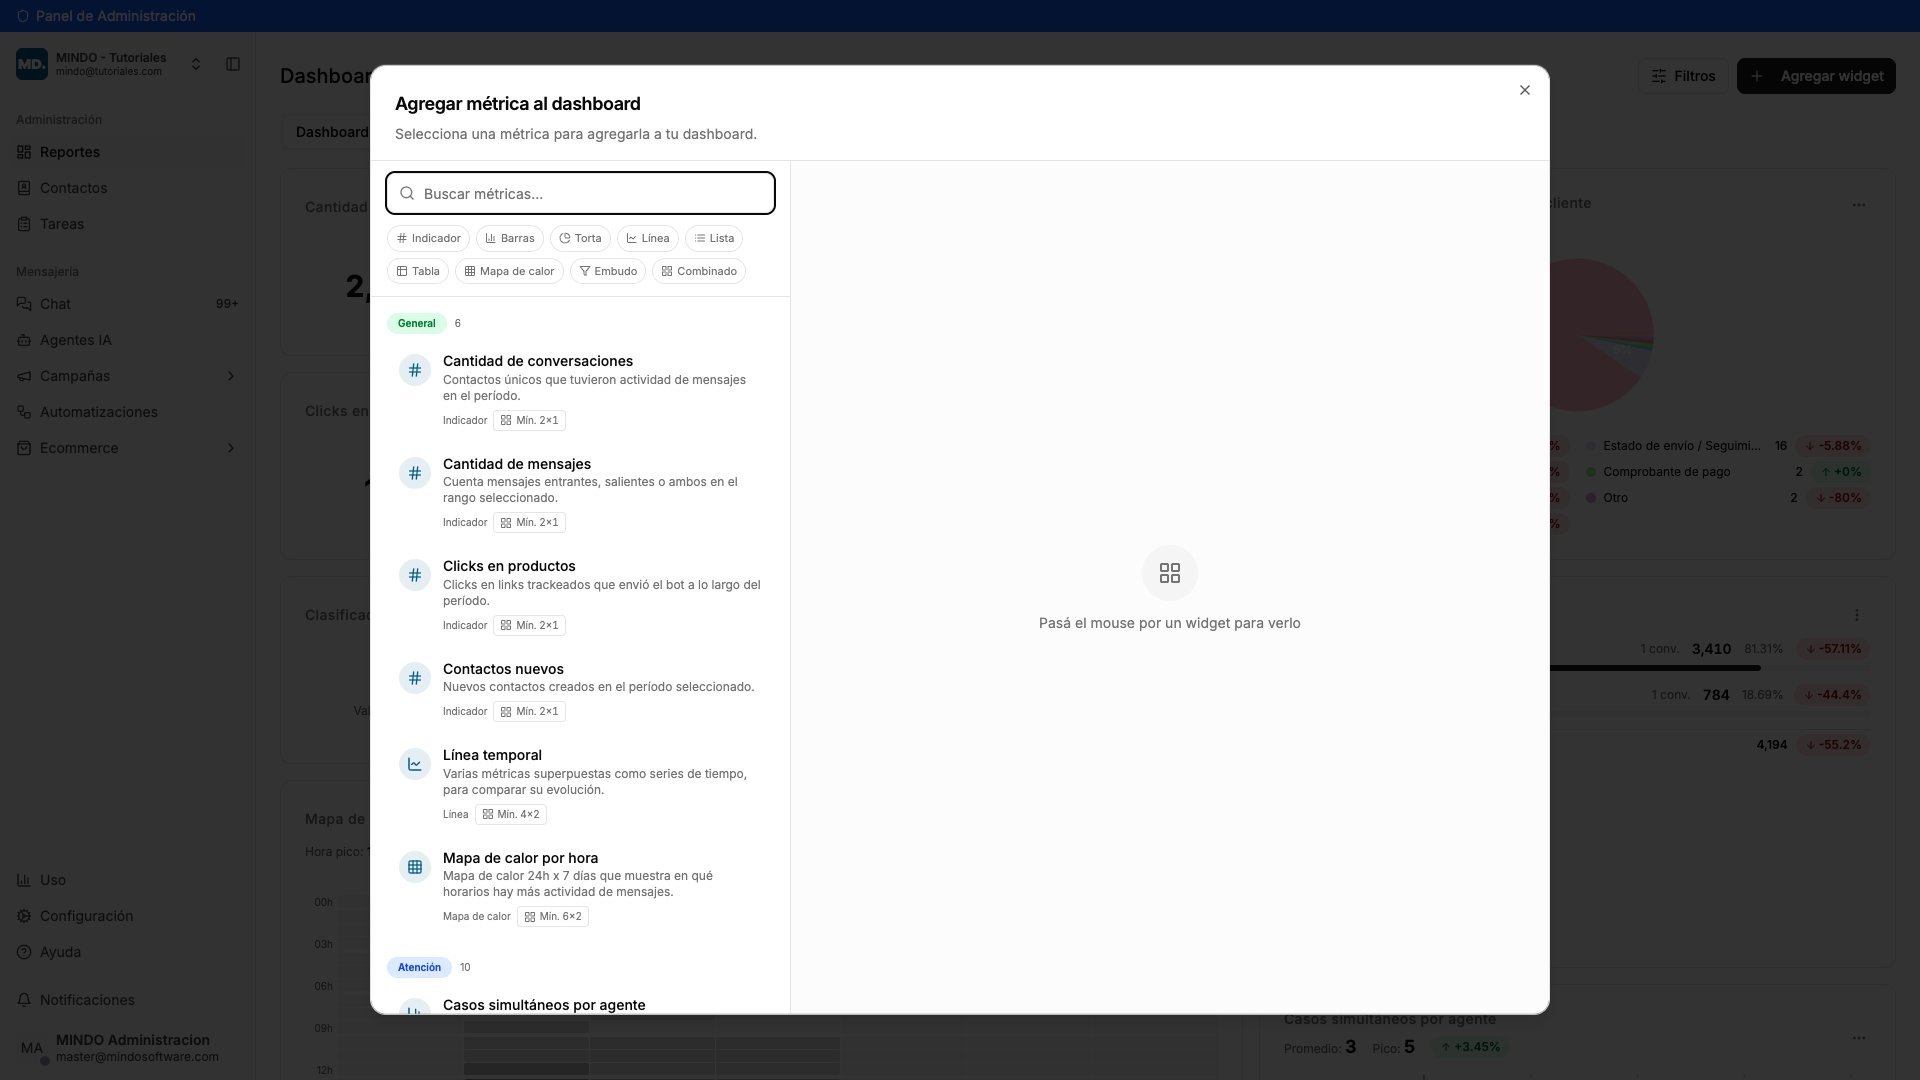
    Click **Add widget** in the top right. A picker opens with every available metric. You can type to search for a specific one, or filter by chart type: indicator, bars, pie, line, list, table, heatmap, funnel or combined.

    <Frame caption="Metric picker with the chart type filters">
      <img src="https://mintcdn.com/mindo/W8xWRflm-dE_uZ_a/images/tablero-dashboard-02-agregar-widget.png?fit=max&auto=format&n=W8xWRflm-dE_uZ_a&q=85&s=460b5e1f42b502b8578b59be6340adc3" alt="Add metric to dashboard modal with the search box, chart type filters and the list of metrics" width="1920" height="1080" data-path="images/tablero-dashboard-02-agregar-widget.png" />
    </Frame>
  </Step>

  <Step title="Preview it before adding">
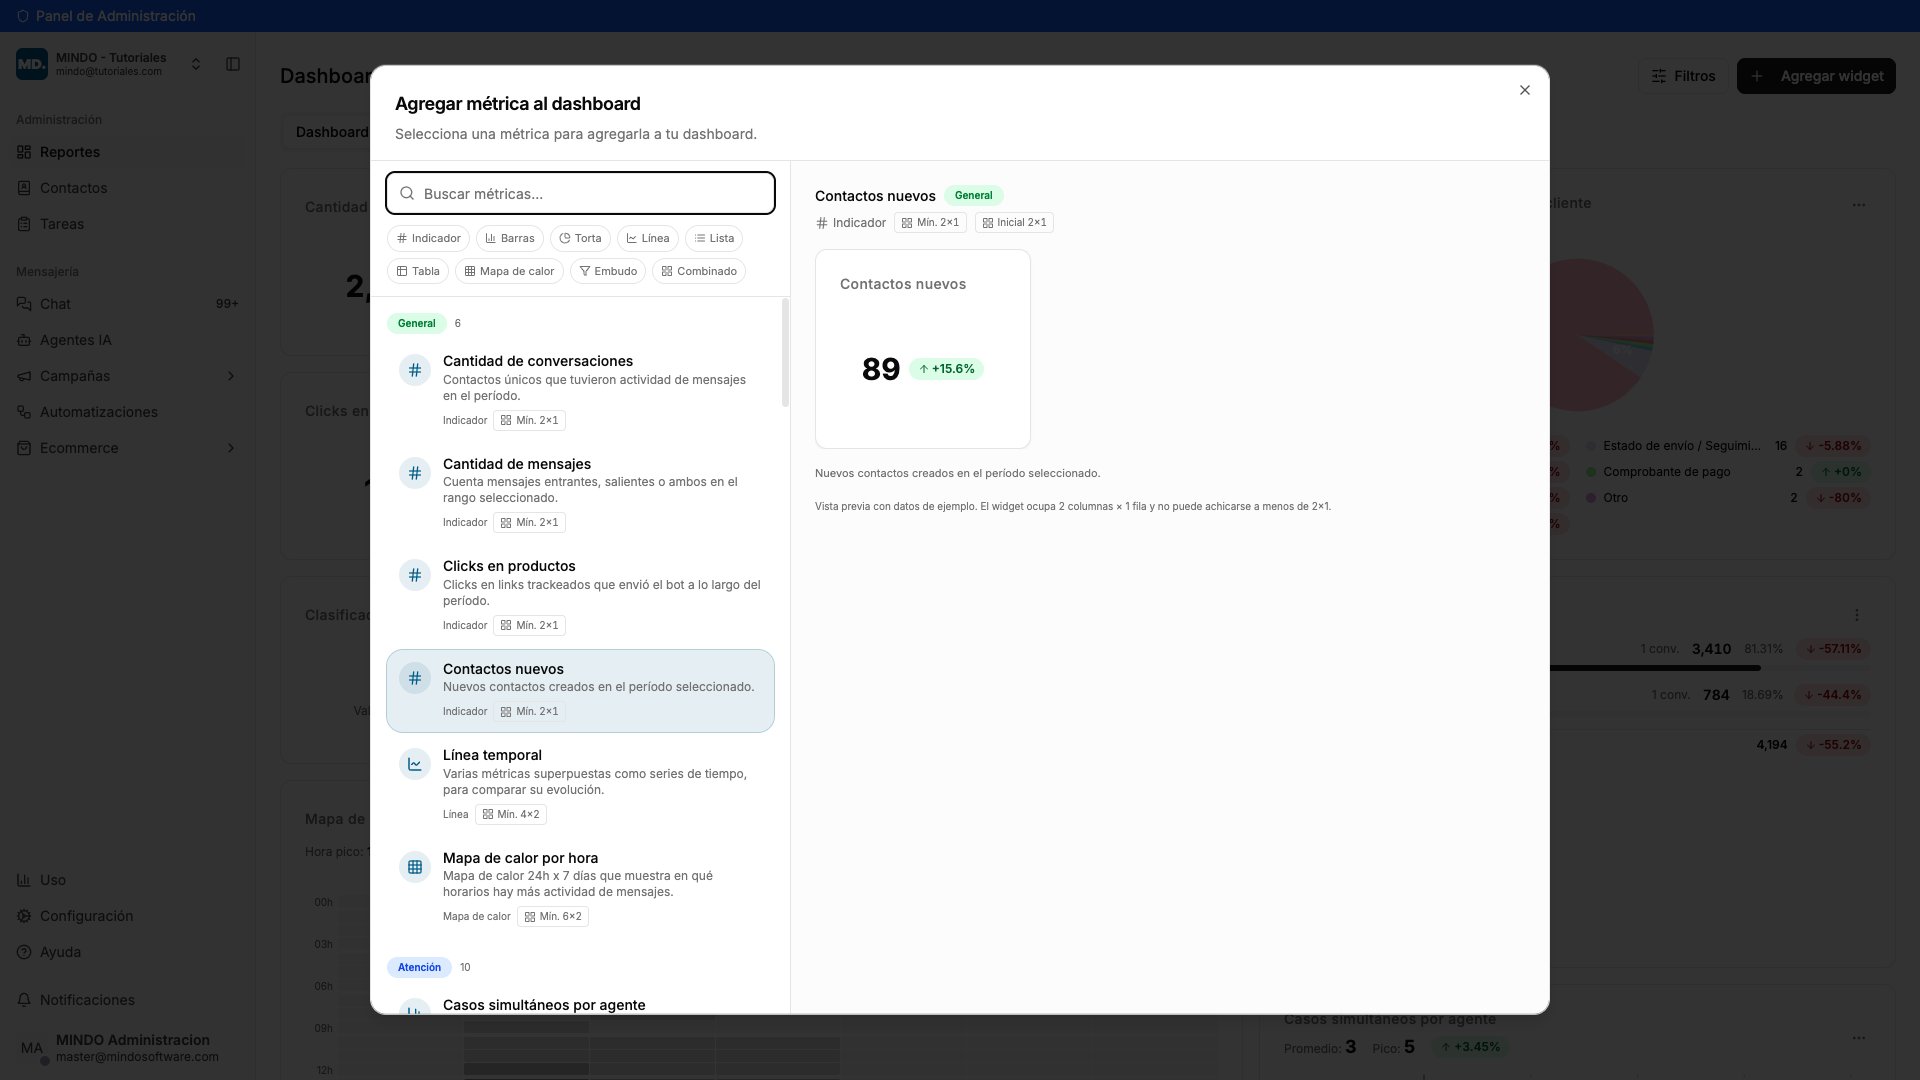
    Hover over a metric and you'll see how it looks on the right. Below the example it tells you **how much space it takes up** on the board and its **minimum size**.

    Once you find the one you want, click it. Some are added right away, others ask you to pick a value first. To finish, click **Add metric**.

    <Frame caption="Metric preview showing its minimum size">
      <img src="https://mintcdn.com/mindo/W8xWRflm-dE_uZ_a/images/tablero-dashboard-03-preview.png?fit=max&auto=format&n=W8xWRflm-dE_uZ_a&q=85&s=9b4193280d270fb287e6b65e2bb17bac" alt="Preview of the New contacts widget showing how much space it takes up on the board" width="1920" height="1080" data-path="images/tablero-dashboard-03-preview.png" />
    </Frame>
  </Step>

  <Step title="Move it by dragging">
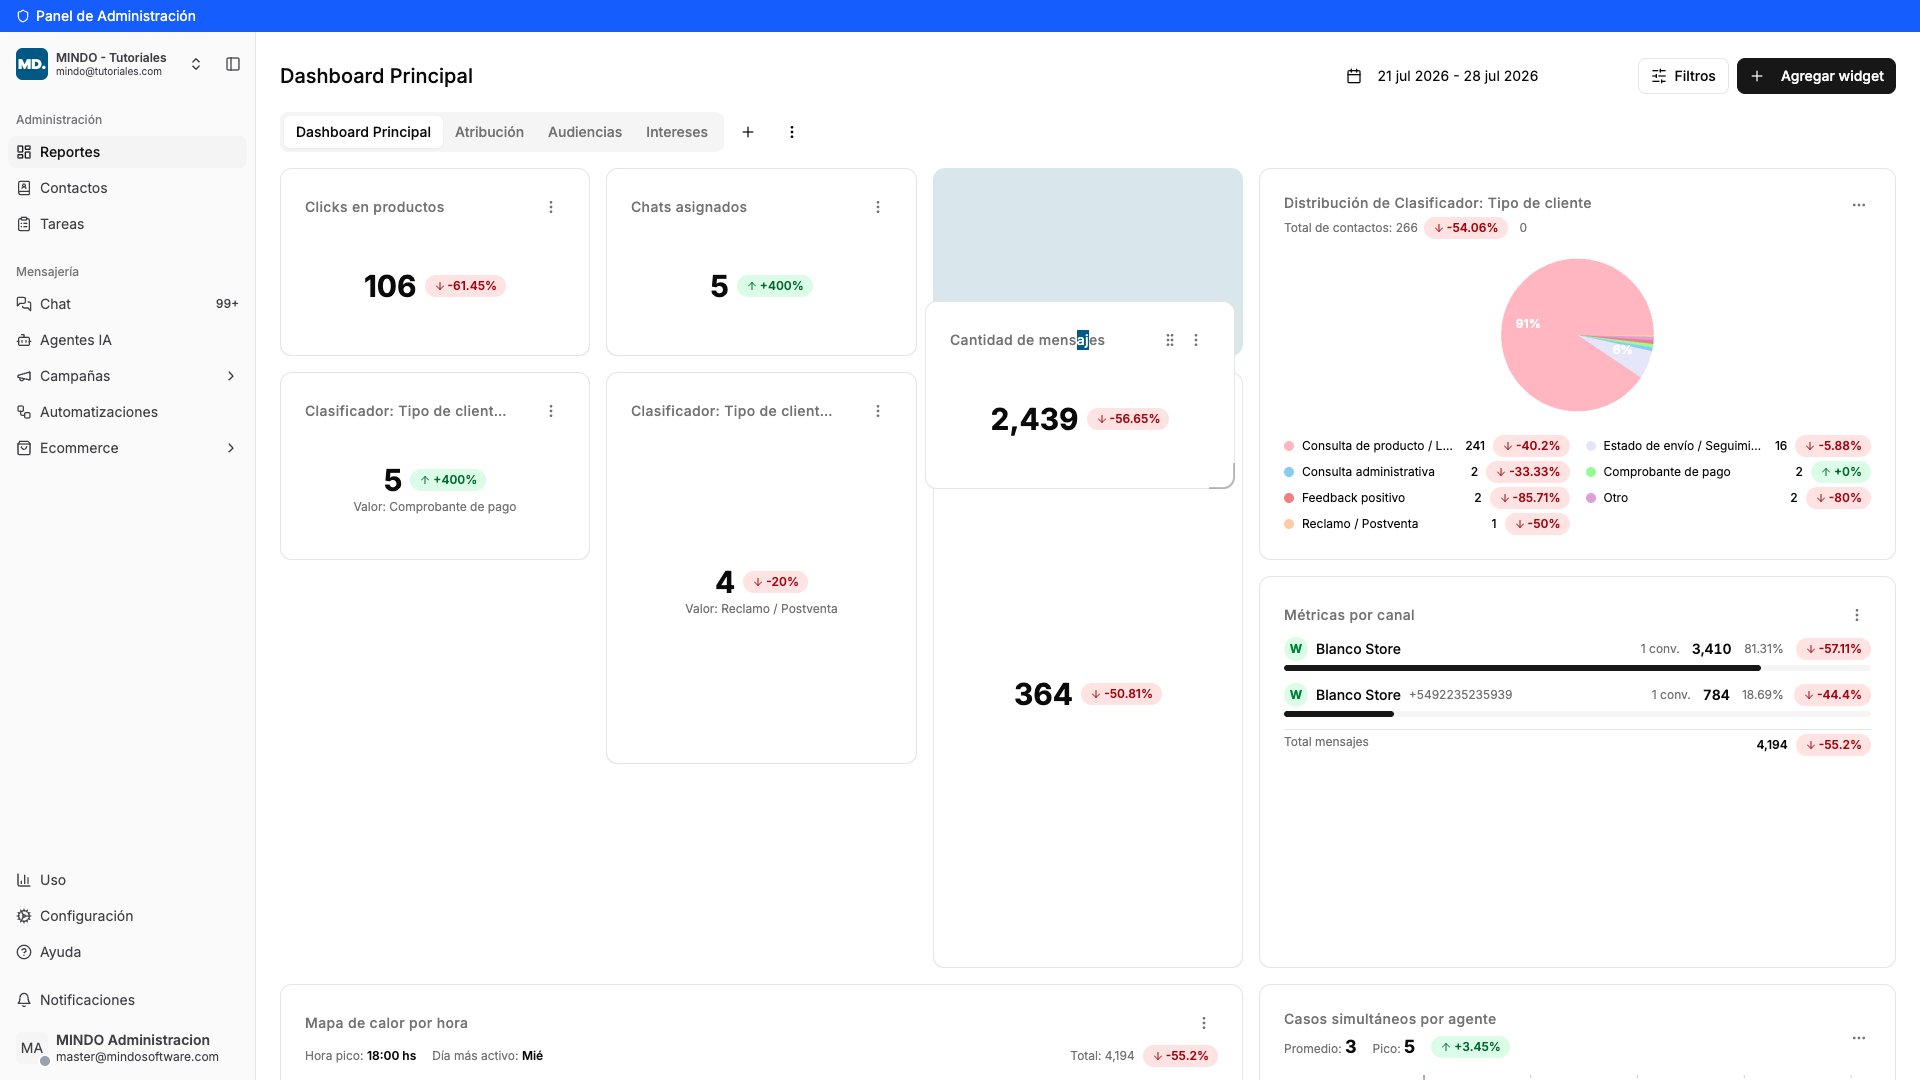
    New widgets always land at the bottom of the board. To move one, grab it by its **title** and drag. As you move it you'll see a **highlighted gap** showing where it will land, and the other widgets shift out of the way. Release the mouse and you're done.

    <Frame caption="Widget being dragged with the highlighted target gap">
      <img src="https://mintcdn.com/mindo/W8xWRflm-dE_uZ_a/images/tablero-dashboard-04-arrastrar.png?fit=max&auto=format&n=W8xWRflm-dE_uZ_a&q=85&s=c64ea802d3136e32290f5d8aacf837ef" alt="Widget being dragged with the highlighted gap showing where it will land" width="1920" height="1080" data-path="images/tablero-dashboard-04-arrastrar.png" />
    </Frame>
  </Step>

  <Step title="Resize it">
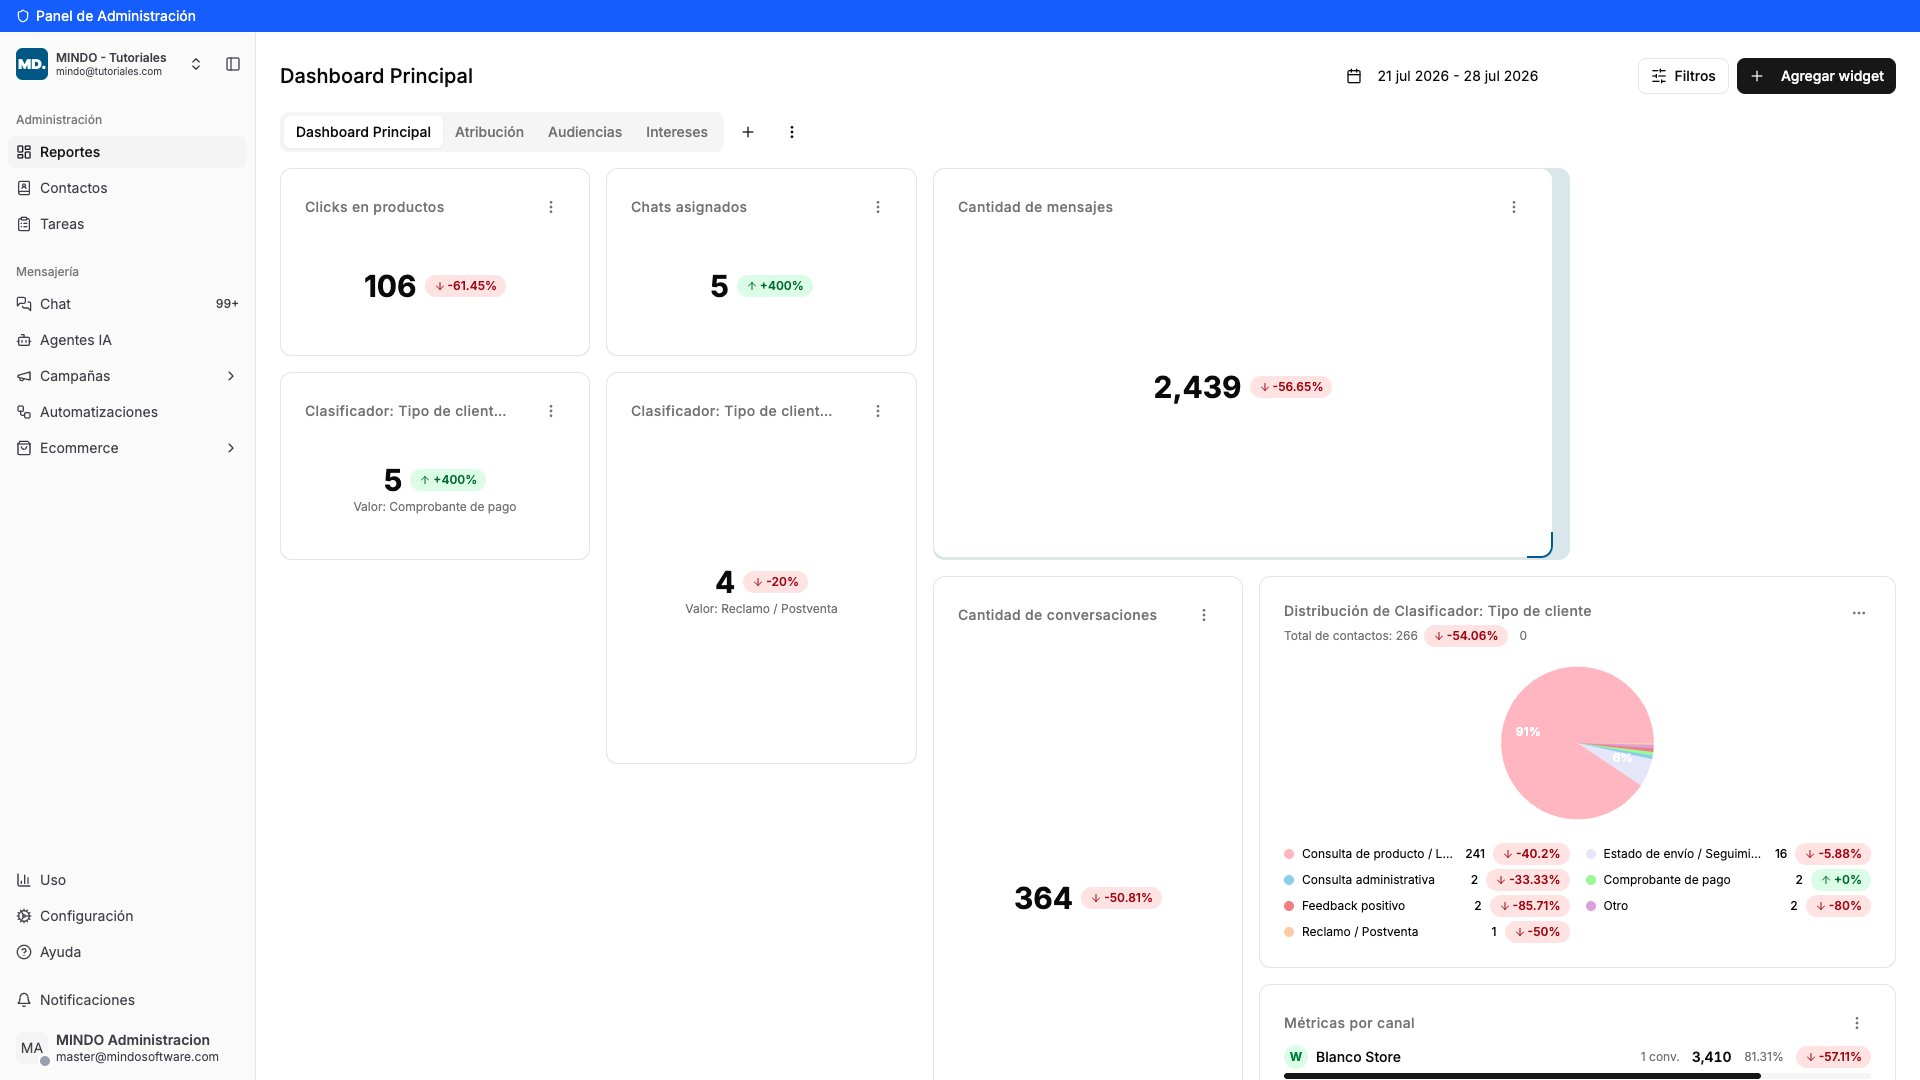
    Move your mouse to the **bottom-right corner** of the widget and drag from there. You'll see in real time how much space it will take up. This is handy for giving more prominence to the metrics you check most, or so charts show more detail.

    <Frame caption="Resizing a widget from its bottom-right corner">
      <img src="https://mintcdn.com/mindo/W8xWRflm-dE_uZ_a/images/tablero-dashboard-05-redimensionar.png?fit=max&auto=format&n=W8xWRflm-dE_uZ_a&q=85&s=f7540abd4da0a6186647fae5321eb90c" alt="Widget being resized from its bottom-right corner with the target area highlighted" width="1920" height="1080" data-path="images/tablero-dashboard-05-redimensionar.png" />
    </Frame>
  </Step>

  <Step title="Use each widget's menu">
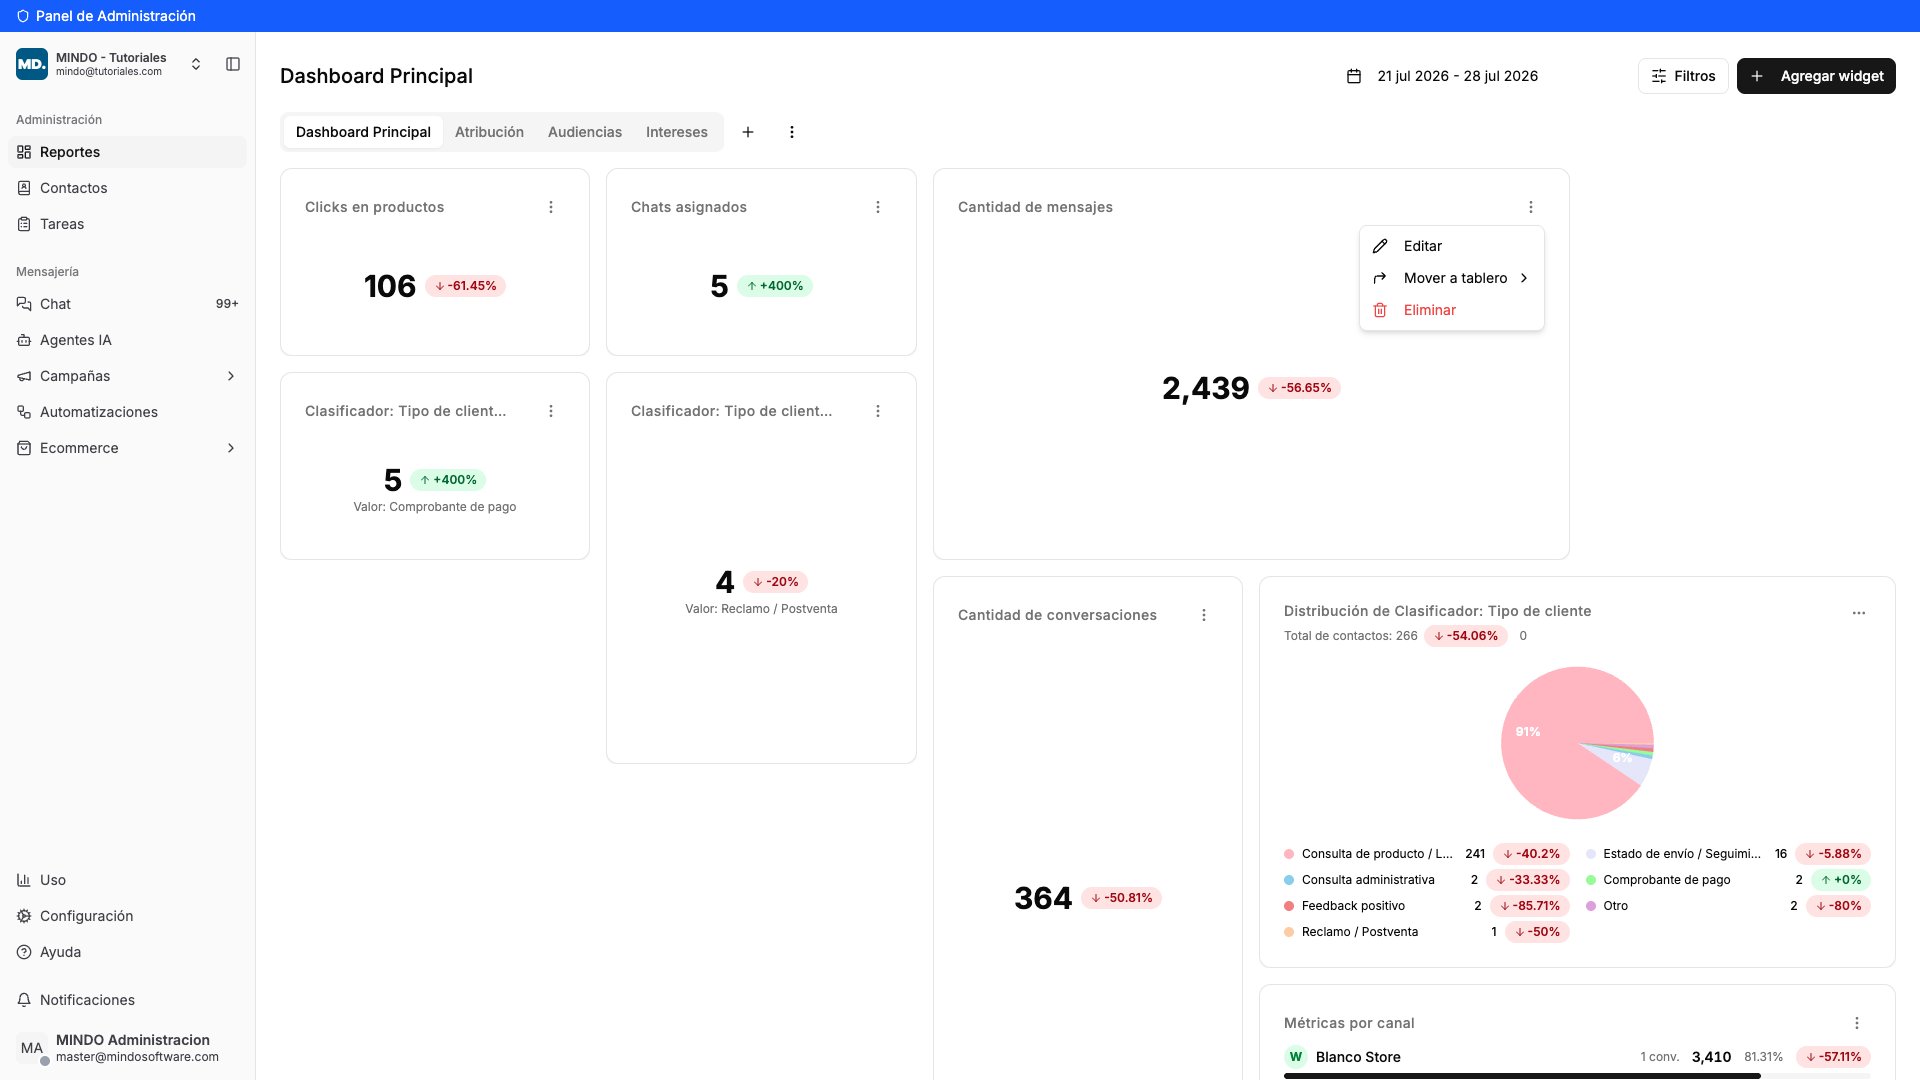
    Every widget has a **three-dot** menu in its top right corner:

    * **Edit** — change its settings.
    * **Move to board** — send it to another one of your boards.
    * **Delete** — remove it from the board.

    <Frame caption="Widget options menu">
      <img src="https://mintcdn.com/mindo/W8xWRflm-dE_uZ_a/images/tablero-dashboard-06-menu-widget.png?fit=max&auto=format&n=W8xWRflm-dE_uZ_a&q=85&s=a60f62abdb5e792e4858b5553814a4ce" alt="Widget menu showing the Edit, Move to board and Delete options" width="1920" height="1080" data-path="images/tablero-dashboard-06-menu-widget.png" />
    </Frame>
  </Step>

  <Step title="Create a new board">
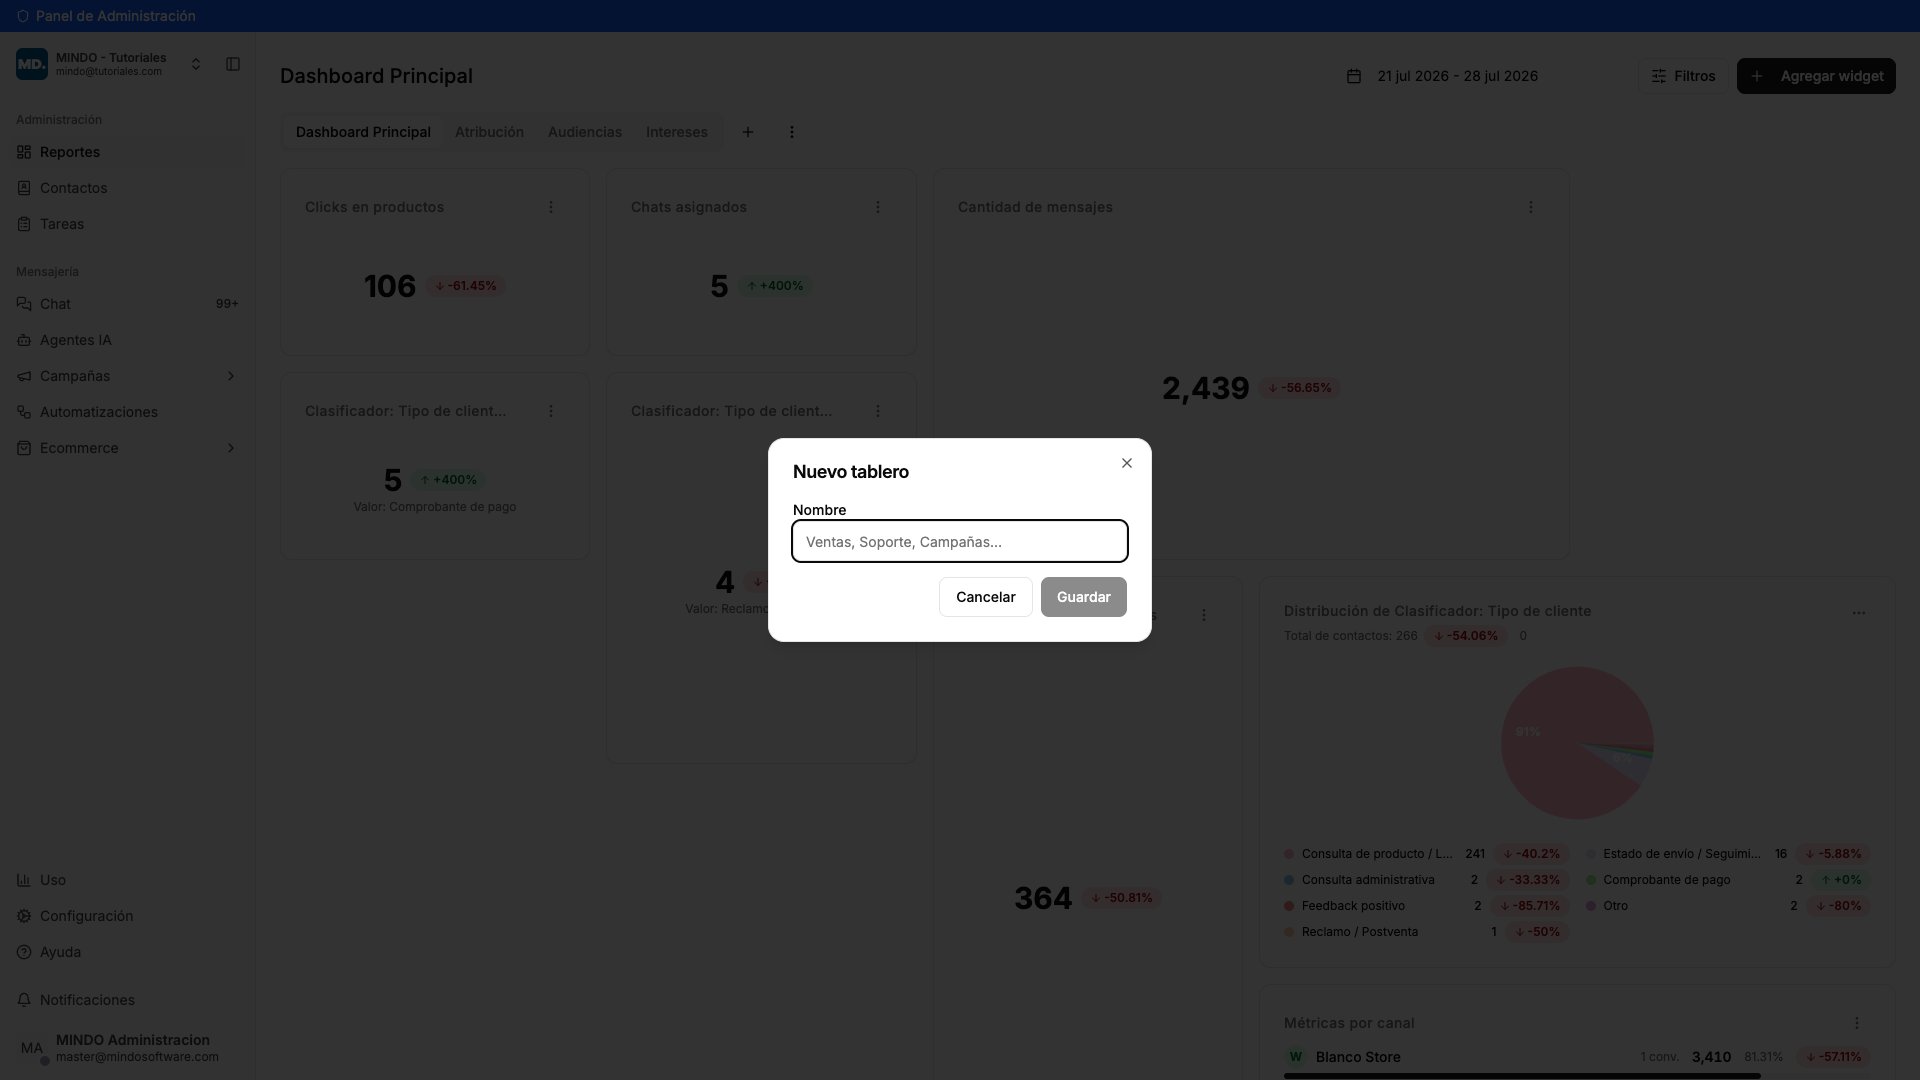
    Click the **+** next to the tabs, give it a name (for example *Sales*) and click **Save**.

    <Frame caption="New board dialog">
      <img src="https://mintcdn.com/mindo/W8xWRflm-dE_uZ_a/images/tablero-dashboard-07-nuevo-tablero.png?fit=max&auto=format&n=W8xWRflm-dE_uZ_a&q=85&s=b1fe69a3922c35ff878bd786e97e7e76" alt="New board dialog with the Name field and the Cancel and Save buttons" width="1920" height="1080" data-path="images/tablero-dashboard-07-nuevo-tablero.png" />
    </Frame>
  </Step>

  <Step title="Fill it with the metrics you need">
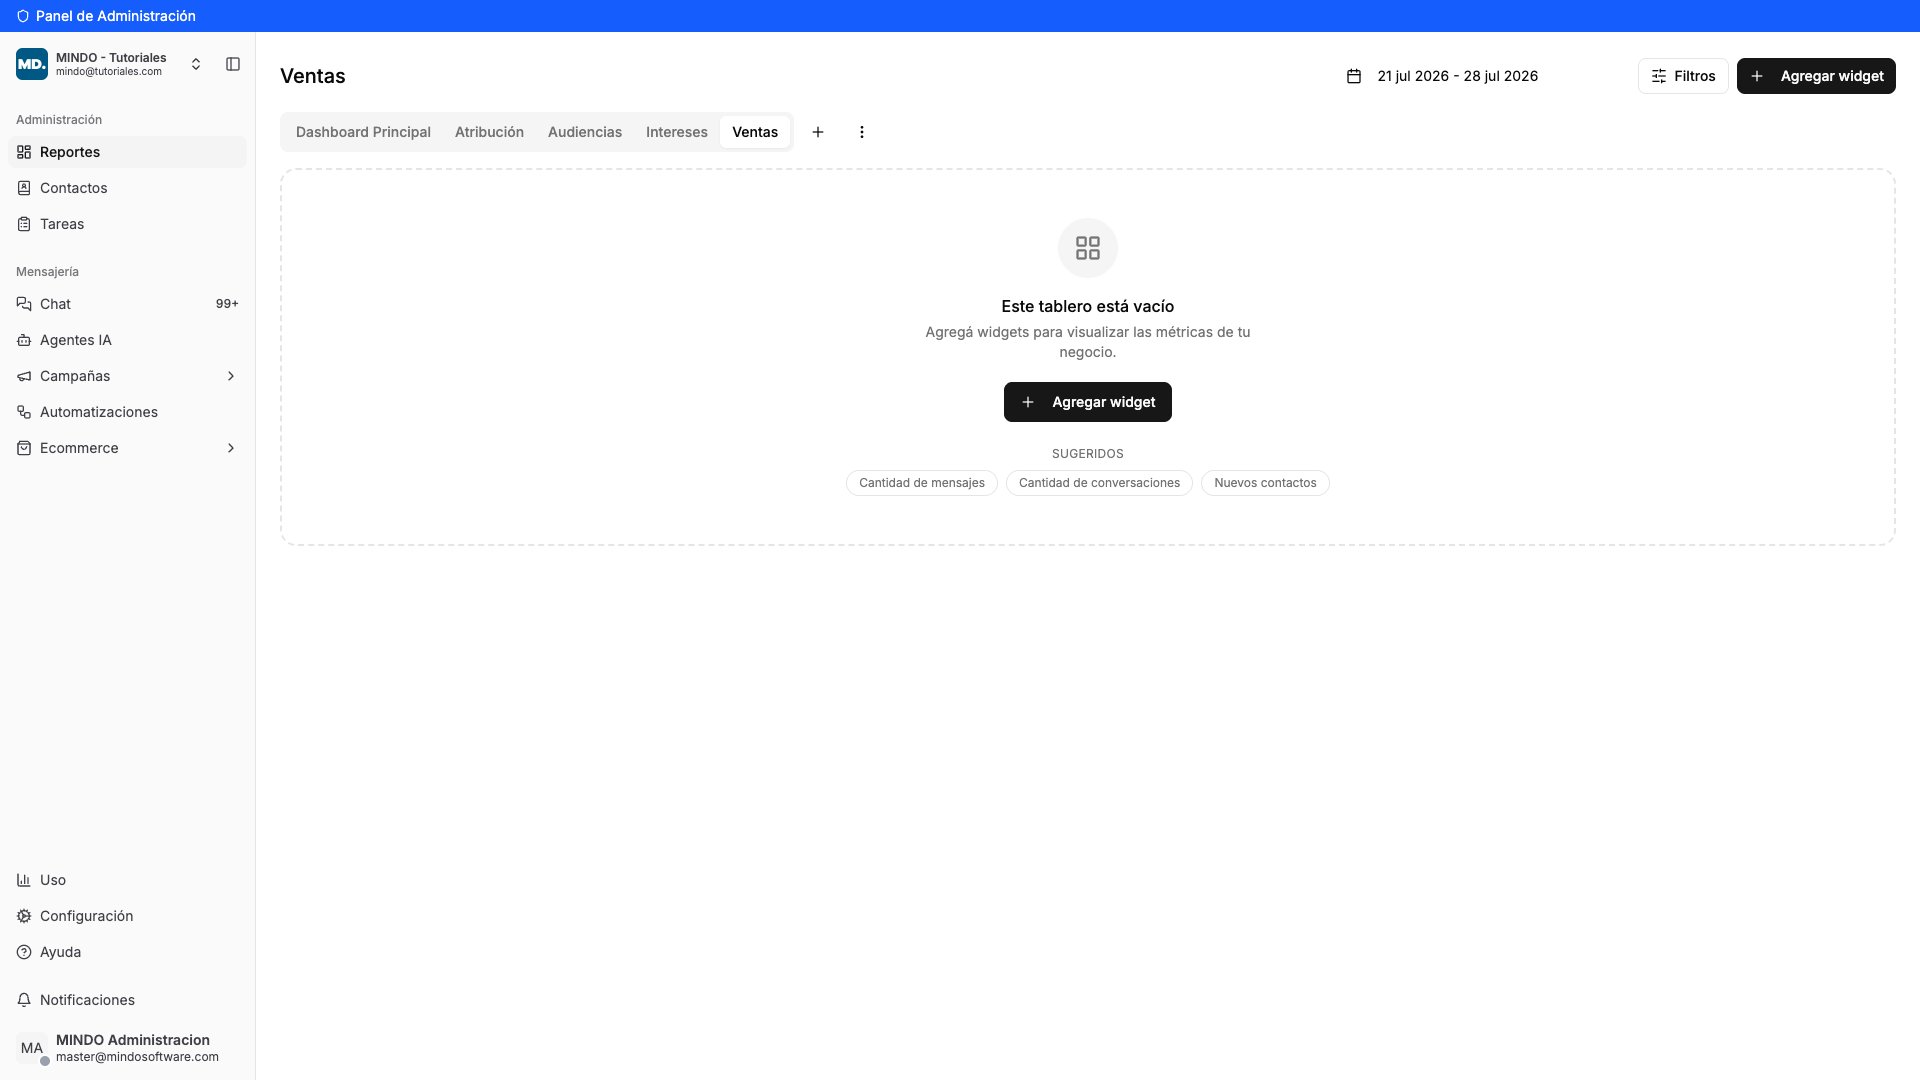
    A new board starts empty. You can click **Add widget**, or use the **suggested metrics** shown below to get going faster.

    The idea is for each board to group the metrics for one topic: one for sales, one for support, one for campaigns.

    <Frame caption="Empty board with suggested metrics">
      <img src="https://mintcdn.com/mindo/W8xWRflm-dE_uZ_a/images/tablero-dashboard-08-tablero-vacio.png?fit=max&auto=format&n=W8xWRflm-dE_uZ_a&q=85&s=eef434a9e61184f75fc75c6768c15cfb" alt="Empty new board with the Add widget button and the suggested metrics" width="1920" height="1080" data-path="images/tablero-dashboard-08-tablero-vacio.png" />
    </Frame>
  </Step>

  <Step title="Manage your boards">
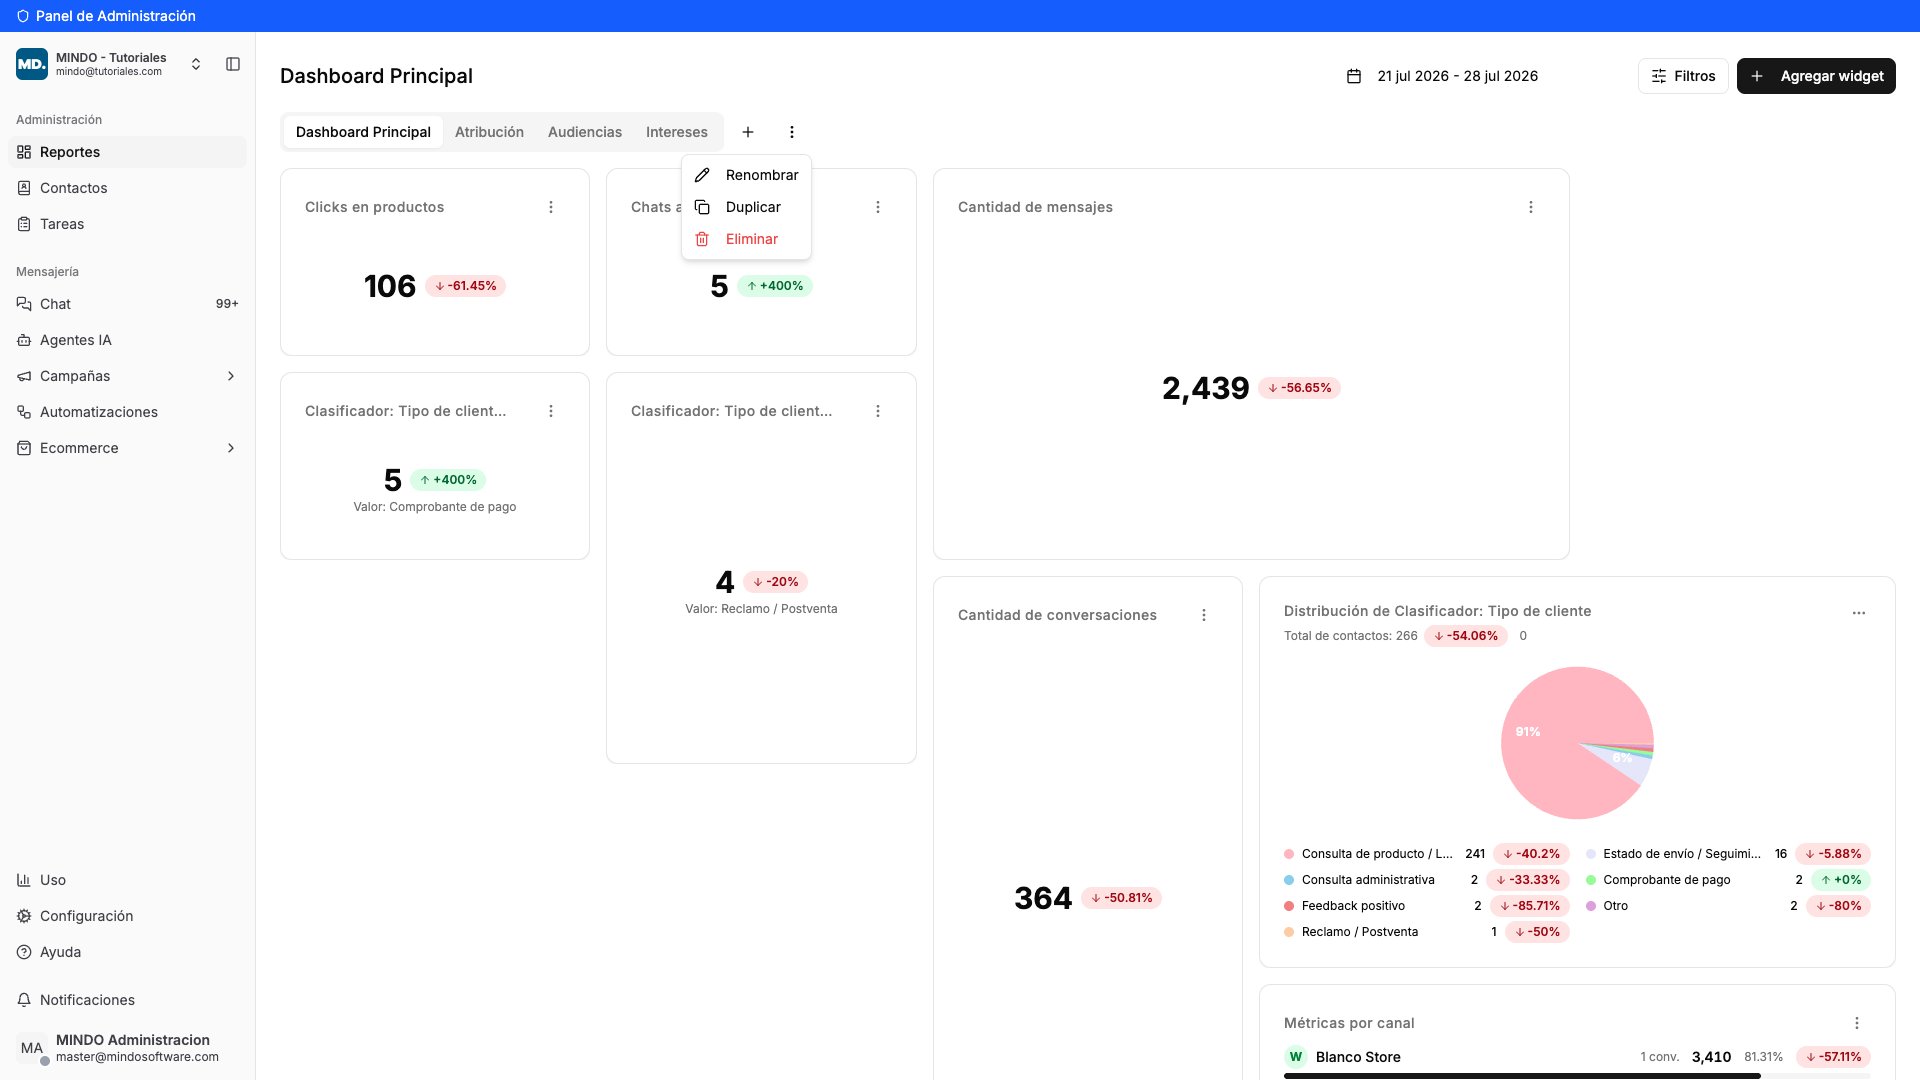
    Click the **three dots** next to the tabs to **rename** the board, **duplicate** it (handy as a template) or **delete** it.

    <Frame caption="Board menu">
      <img src="https://mintcdn.com/mindo/W8xWRflm-dE_uZ_a/images/tablero-dashboard-09-menu-tablero.png?fit=max&auto=format&n=W8xWRflm-dE_uZ_a&q=85&s=ad334c716513cd10eb91fa91823e10c6" alt="Board menu showing the Rename, Duplicate and Delete options" width="1920" height="1080" data-path="images/tablero-dashboard-09-menu-tablero.png" />
    </Frame>
  </Step>

  <Step title="Pick the period and apply filters">
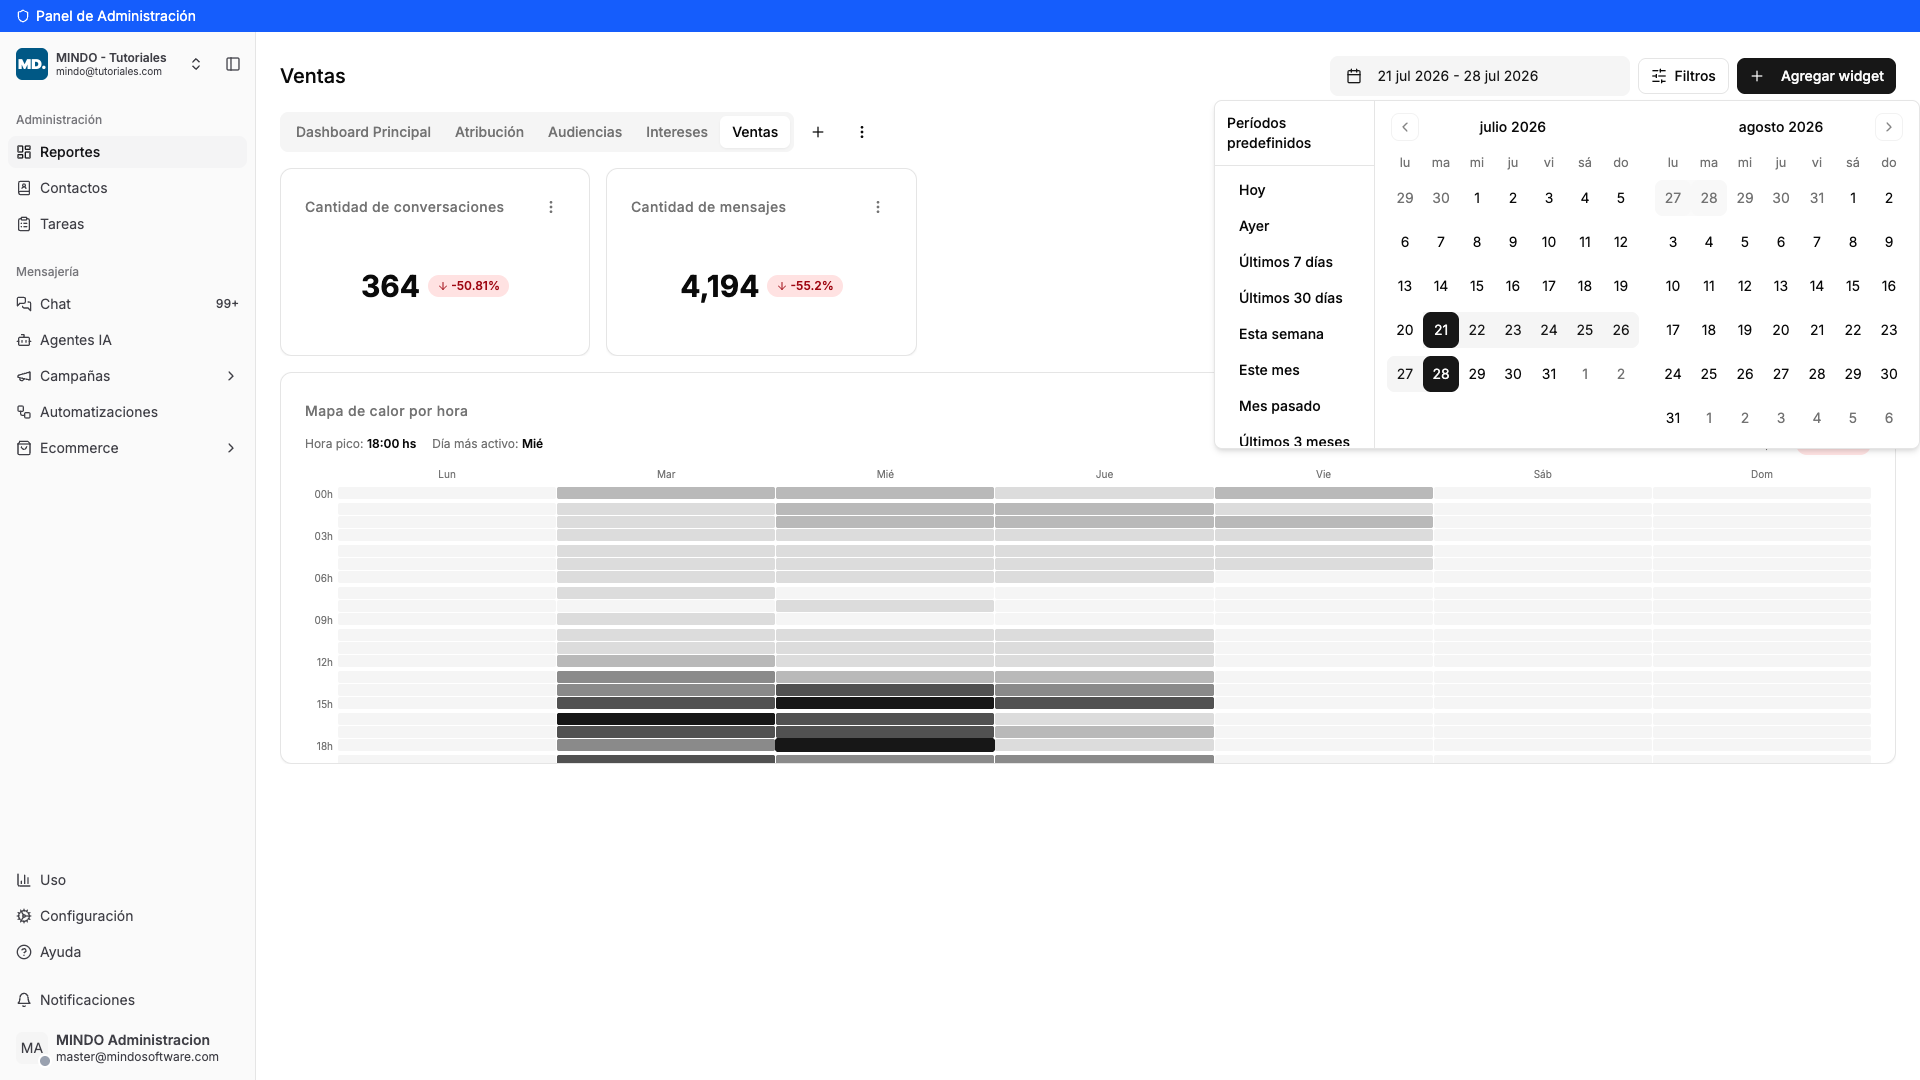
    The **date range** sits in the top right. Every widget on the board shows data for that period. You can pick it on the calendar or use the shortcuts: *Today*, *Yesterday*, *Last 7 days*, *Last 30 days*, *This week*, *This month*, *Last month*.

    Next to it is **Filters**, to see data for a specific channel or team member.

    <Frame caption="Date range with the preset periods">
      <img src="https://mintcdn.com/mindo/W8xWRflm-dE_uZ_a/images/tablero-dashboard-10-fechas-filtros.png?fit=max&auto=format&n=W8xWRflm-dE_uZ_a&q=85&s=1f2f88b883a47a05b16f00a1d65dc7fc" alt="Date range picker with the calendar and the preset periods" width="1920" height="1080" data-path="images/tablero-dashboard-10-fechas-filtros.png" />
    </Frame>
  </Step>
</Steps>

## Result

Your board is now set up your way: with the metrics that matter to you, in the order and size you chose. Every time you open **Reports** you'll find it exactly as you left it.

## Frequently asked questions

<AccordionGroup>
  <Accordion title="Are changes saved automatically or do I have to click Save?">
    They're saved automatically. When you move, resize or add a widget, the board updates instantly. There's no save button.
  </Accordion>

  <Accordion title="Does my whole team see the changes?">
    Yes. Boards belong to the business, so if you rearrange a board or create a new one, your teammates will see it too.
  </Accordion>

  <Accordion title="Can I shrink a widget as much as I want?">
    No. Each metric has a minimum size (for example, 2 columns × 1 row) so it stays readable. The preview tells you what it is before you add it.
  </Accordion>

  <Accordion title="I added a widget and it's empty — why?">
    Two possible reasons: there's no data for the selected period — try widening the date range — or the metric needs you to pick a value in its settings. Open it with the three dots → **Edit**.
  </Accordion>

  <Accordion title="I deleted a widget by mistake, can I get it back?">
    There's no undo, but adding it again takes seconds: **Add widget** and pick it once more. You will have to set its position and size again, though.
  </Accordion>

  <Accordion title="How many boards can I have?">
    As many as you need. A tip: instead of one huge board with everything, build several small ones by topic. They're much easier to read.
  </Accordion>

  <Accordion title="Can the same widget be on two boards?">
    Yes. Add it on each board, or use **Move to board** from the widget menu if what you want is to relocate it.
  </Accordion>
</AccordionGroup>